There are two quick ways to see the whole market at once. A heat map draws every stock in an index as a colored tile, so you see where prices rose and where they fell. A sentiment gauge compresses the same market into a single number for its mood.
The two answer different questions. A heat map shows what prices did. A gauge shows how investors feel about it. This ranking lists one gauge, one heat map app, and three apps that give an overview in their own form: a macro risk score, sentiment per ticker, and a tile view with ranked lists.
-

Sentiscale
Vesper AI
Suits: Investors who want the whole market's mood as one number
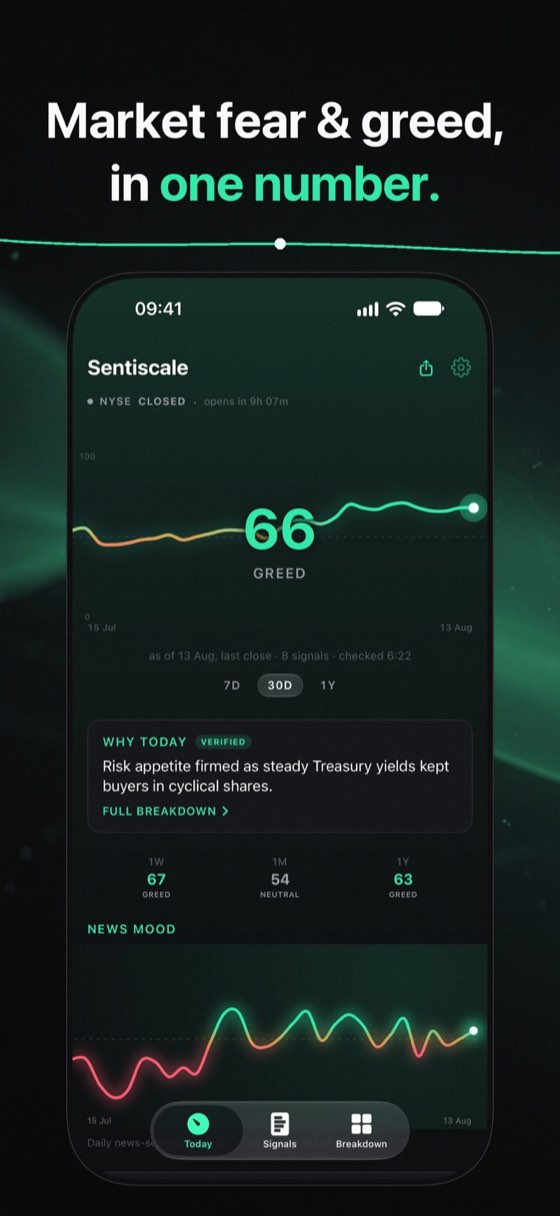
Sentiscale is the gauge in this ranking. Instead of hundreds of tiles, it shows one number from 0 to 100 for each of three regions: the US, Europe and Asia. The US number reads breadth, which measures how many stocks join a move, next to volatility, momentum, safe-haven demand, junk bonds, tail risk, the volatility curve and a model that scores the day's financial news.
For a view closer to a heat map, Pro breaks the reading down by sector. Pro also includes the backtested band signal and a daily explanation with cited headlines.
The gauges, a widget and alerts for extreme fear or greed come with the free tier. US volatility data comes from Cboe, European from STOXX, and equity and sector ETF data from Finnhub. The gauge refreshes every 30 minutes and never shows the price of a single stock.
- US, Europe and Asia
- Free gauge, widget and alerts
- No account, no ads
- Also on Apple Watch and Android
- Price
- Free, Pro from $3.99 a month
- Devices
- iPhone, iPad, Apple Watch
- Last update
- Oct 2026
-

Stock Map
Nazim Can Altinova
Suits: Investors who want the S&P 500 on one screen
Stock Map is the heat map specialist here. Per its App Store listing, it shows the S&P 500, Nasdaq 100 or Dow Jones with tiles sized by market cap and colored by stock performance, and lets you zoom from the full index into sectors, industries and single stocks. You can switch to sortable lists, choose equal tile sizes and pick a color-blind friendly palette.
- Price
- Free
- Devices
- iPhone, iPad
- Last update
- Sep 2026
-

MacroStaq
iInnovate Limited Liability Company
Suits: Macro-minded investors who want a single stress score
MacroStaq reads the market through a macro lens. Per its App Store listing, it combines eight pillars into a real-time risk score: volatility, credit spreads, liquidity, growth, sentiment, yield curve, inflation and breadth. The score shows how stressed markets are and whether conditions are improving or deteriorating. The listing also describes a signal heat map that ranks more than 200 cross-asset signals by strength.
- Price
- Free
- Devices
- iPhone, iPad
- Last update
- Apr 2026
-

Stocktwits
StockTwits, Inc.
Suits: Traders who follow sentiment on one ticker at a time
Stocktwits shows sentiment ticker by ticker. The listing states that real-time bullish and bearish sentiment is available on nearly every kind of asset, from single equities and indexes to currencies and commodities. Per its App Store listing, the app also shows which symbols are discussed most each day, next to trending stocks, news and an earnings calendar. Discussion happens in a community of millions of investors.
- Price
- Free
- Devices
- iPhone, iPad
- Last update
- Nov 2026
-

Barchart
Barchart.com, Inc.
Suits: Market followers who like ranked lists of daily movers
Barchart covers stocks, futures, forex, ETFs and indices. Per its App Store listing, the app brings most of the ranked lists of daily performers from Barchart.com and offers what it calls a tile marketwatch view. Each symbol comes with charts, technicals, fundamentals and opinions, including a buy, sell or hold opinion that the listing calls unique to Barchart.
- Price
- Free
- Devices
- iPhone, iPad
- Last update
- Nov 2023
Compare at a glance
| App | Price | Devices | Last update |
|---|---|---|---|
| Sentiscale | Free, Pro from $3.99 a month | iPhone, iPad, Apple Watch | Oct 2026 |
| Stock Map | Free | iPhone, iPad | Sep 2026 |
| MacroStaq | Free | iPhone, iPad | Apr 2026 |
| Stocktwits | Free | iPhone, iPad | Nov 2026 |
| Barchart | Free | iPhone, iPad | Nov 2023 |
Source: US App Store listings, read on 17 Nov 2026. "Devices" lists the Apple devices each listing names.
How we picked
We read App Store listings for apps that show the market at a glance, as a heat map, a tile view, a gauge or a sentiment reading. Each entry repeats what its listing states. We ran no lab tests and judged no accuracy.
The first entry leads; the others follow in no order of quality.
Reading a heat map next to a gauge
A heat map that is mostly red tells you prices fell. It does not tell you whether investors are calm about it. A sentiment gauge adds that part. Read together, the two show the move and the mood behind it, without saying what comes next.
Questions and answers
What do the colors on a stock heat map mean?
In Stock Map, per its listing, the color of a tile shows how that stock performed and its size shows market cap. Other apps may use other rules.
Is a heat map a sentiment indicator?
Not directly. It shows price moves. A sentiment gauge combines several signals, such as volatility and news, into one reading of mood.
Can I see the mood of one sector?
Sentiscale Pro breaks its reading down by sector. Stock Map shows how a sector's stocks performed when you zoom in; that is price, not mood.